
Foot Locker, the US athletics retailer owned by Dick's Sporting Goods1, depends heavily on Nike's Jordan brand. Analysts put Jordan at roughly 25% of its revenue, and Nike said in October 2026 that it would pull back on retro Jordan launches to correct an oversupply1. For a seller, the bigger risk is not the size of one supplier's share but that the supplier sets the timing of any cut. This article uses the Foot Locker case to show how to measure that exposure before it arrives.
What is Foot Locker's Jordan exposure, and what has changed?
Jordan is Nike's basketball subbrand, and Foot Locker is its largest wholesale partner1. Wholesale means the retailer buys stock from the brand and resells it. Nike's Jordan revenue fell in the mid-teens in its latest quarter, and CEO Elliott Hill said the company would pull back on retro Jordan launches to correct for an oversupply1.
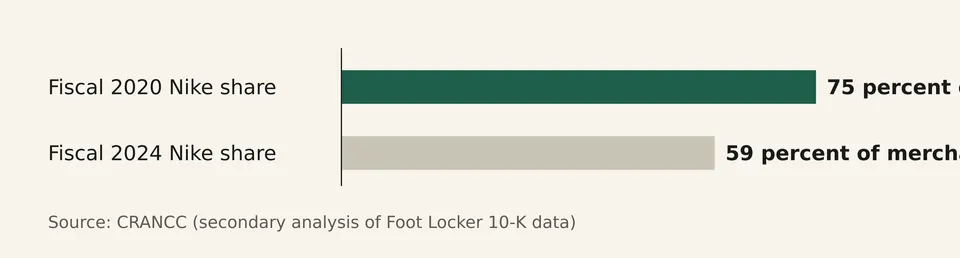
Foot Locker's dependence on Nike has already been falling. Nike accounted for 75% of all merchandise Foot Locker purchased in fiscal 2020, and 59% in fiscal 2024, according to a CRANCC analysis of Foot Locker's 10-K filings, the annual reports it filed with the US Securities and Exchange Commission3. Foot Locker filed no 10-K after March 2025, so that series ends at fiscal 20243.
Europe is a separate pressure point. It accounts for about 20% of Foot Locker's sales and is described as a roughly $115 million drag on profitability1. BMO Capital Markets' analyst Kelly Crago suggested the company could shut the European business, and that Dick's could sell WSS, a Foot Locker banner, or close Champs1.
How big could the hit be?
The estimates come from two brokerage analysts, and they measure different things: one a sales figure, the other a comparable-sales effect.
BNP Paribas estimates Jordan generates roughly $1.85 billion for Foot Locker, and that Foot Locker would take a roughly $550 million sales hit starting in spring 2027 unless it finds replacements for the Jordan volume1. BNP's analyst, Laurent Vasilescu, wrote: "If Jordan is down 30% next year, Dick's has a hole to fill at Foot Locker, which we don't think can be replaced by other brands due to the average selling price differential"1. Average selling price is the typical price per item sold.
BMO estimates the Jordan pullback will have a 250 to 550 basis point impact on Foot Locker's comparable sales in fiscal 20271. A basis point is one hundredth of a percentage point, so this is a 2.5 to 5.5 percentage-point drag2. Comparable sales measure sales at stores or businesses open for a set period.
Dick's has already cut its outlook. It lowered the Foot Locker Business proforma comparable sales outlook for 2026 to negative 2.0% to 0.0%, and reported a 3.6% decline in Foot Locker comparable sales for the second quarter2. Proforma means the figures are calculated as if Foot Locker had been owned from the start of the periods shown2.
Our analysis: why concentration is a timing risk
Our reading is that the danger is less the percentage than the speed and the lack of warning. A supplier can change allocation, launch cadence or reorder terms with little notice, while the retailer or seller carries the stock and fixed costs bought before the change. Dick's own explanation shows how launch-driven product can slip: "Not only were there fewer launches in the second quarter, but those launches performed below both industry and our expectations"2.
Replacement is slow and uneven. BNP's view is that other brands are unlikely to fill the gap because of the price difference, and that Foot Locker could lean on partners such as Vans and New Balance, but that their lower prices would require Foot Locker to sell a higher volume1. For a seller, a lower-priced substitute can look fine on revenue and still deliver less gross profit per order.
The same pattern applies to a small seller who relies on one supplier or one marketplace. The exposure is not only how much revenue comes from that source, but who controls the exit date.
How do you measure your exposure before it happens?
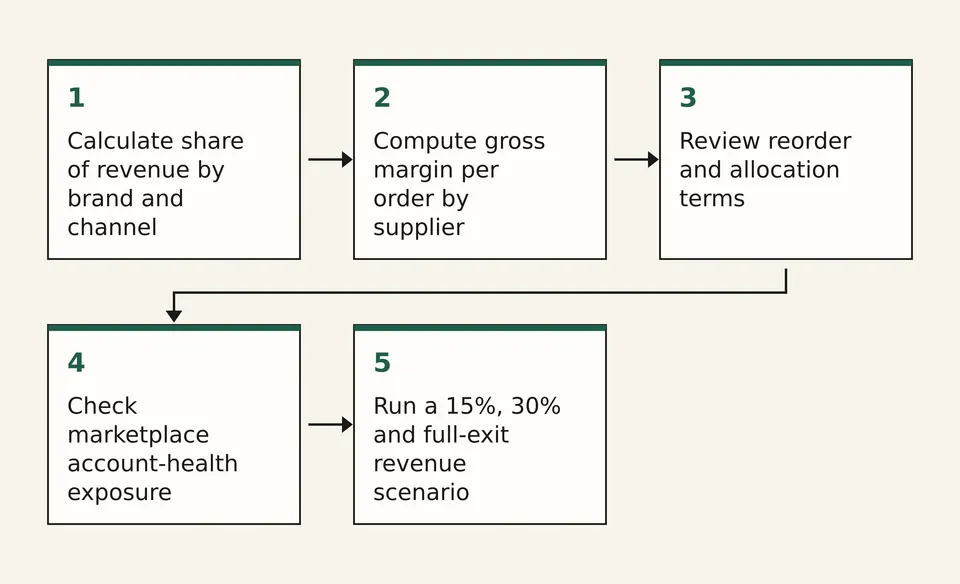
Run these five checks before a supplier or marketplace sets the timetable:
- Calculate share of revenue by brand and channel
- Compute gross margin per order by supplier
- Review reorder and allocation terms
- Check marketplace account-health exposure
- Run a 15%, 30% and full-exit revenue scenario1
Step 1. Use trailing twelve-month revenue. Show the top supplier and the top channel separately, because a seller can be exposed to either.
Step 2. Compare gross profit per order rather than revenue per order, so that lower-priced substitutes are judged on what they actually earn.
Step 3. Write down how much notice you receive for allocation cuts, whether reorders are guaranteed, and what happens to open purchase orders. These terms are rarely in a sales report, so they need a separate check.
Step 4. Amazon's seller forum post on appealing deactivations, from a moderator and dated 22 October 2024, states that failure to adhere to its performance metrics and policies "may lead to the temporary deactivation of your account, removal of listings, or limit your use of the Merchant Fulfilled Network (MFN)"4. For a single-marketplace seller, this is the same single-point-of-failure risk in a different form.
Step 5. Model three cases: a 15% cut, a 30% cut and a full exit1. For each, record the revenue loss, the gross profit loss and the months of cash you could cover without new sales. The 15% and 30% levels are our planning choices, not sourced figures1.
What would a 30% pullback look like for a small seller?
The following is illustrative arithmetic, with invented numbers and no sourced data.
Revenue is the first number to check, but not the last. If the lost supplier's products carried higher margin than the replacement, gross profit falls by more than revenue does. Storage, software and staff costs may not shrink with the supplier, so the operating loss can be larger than the revenue loss suggests. We recommend that a seller compute the profit gap and the months of fixed costs covered by cash, not only the sales gap.
What should readers watch next?
- Foot Locker's fiscal 2027 comparable sales against BMO's 250 to 550 basis point range of Jordan pressure1. A result near the bottom of that range would, in our reading, suggest replacement brands are filling the gap.
- Whether Dick's restructures the European business, given the roughly $115 million profitability drag reported by S11, or moves to sell WSS or close Champs1.
- Nike's Jordan launch cadence. Dick's second-quarter commentary linked launch performance to retailer results2, so fewer or weaker launches are an early signal in our view.
- New share data. Because Foot Locker's 10-K series ends at fiscal 20243, a fresh figure for Nike's share of purchases would need a different disclosure, and its absence is itself a point to note.
Questions readers ask
How much of Foot Locker's revenue depends on Jordan?
Analysts put Jordan at roughly 25% of Foot Locker's revenue1. The article notes that this is a brokerage estimate rather than a company-reported figure.
How big could the Jordan pullback hit Foot Locker?
BNP Paribas estimates a roughly $550 million sales hit starting in spring 2027 unless Foot Locker replaces the Jordan volume1. BMO estimates a 250 to 550 basis point impact on fiscal 2027 comparable sales1.